Strange graphs and dynamic programming
Kai Wolf 09 August 2019

There exists a YouTube channel called Numberphile that discusses all interesting sorts of mathematics. I really do enjoy watching most episodes as they usually talk about interesting findings and mathematical phenomena that can also be understood by non-mathematicans.
In a recent episode some rather strange graph progressions were shown. One that stood out to me was defined by a very simple, recursive function:
from math import gcd

def a(n):
    if n < 2: return 1
    if gcd(n, a(n - 1)) == 1: return a(n - 1) + n + 1
    return int(a(n - 1) / gcd(n, a(n - 1)))
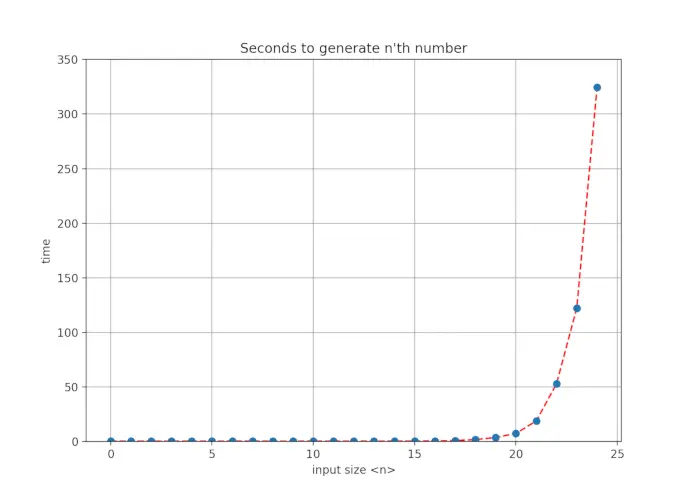
However, when trying to plot this graph for any given n greater than 10 or so, one quickly realizes that the execution time quickly increases exponentially. Indeed, if we look again at the recursive calls of the function a(n), we can observe that for each number up to n, we have at least two more calls. Another way to think about this is to represent each function call as a node in a recursion tree (or rather a graph), where each of the leaves on the tree are all a(0) and a(1). Those signify the base cases.
The root node has two child nodes and each of those child nodes has again two child nodes. If we count this n times, we get roughly O(2^n) nodes, which to the experienced eye means exponential runtime. Indeed, if we plot the runtime in seconds for an increasing number of n, we get:

If we study again the recursion tree, we can see that lots of identical nodes are computed over and over again, due to the nature of recursively calling a(n) again for the same input. In fact, each call to a(n_i) shouldn’t be computed more than once, since the return value won’t change for the same input. Hence, the overall should runtime should rather be O(n).
One common solution for this type of problems is called dynamic programming. Even though this term may sound a bit daunting at first, it’s mostly just a matter of using a recursive function and saving intermediate results in a cache. Hence, for this problem, we can just save intermediate results of a(n_i) and return those back in recursive function calls:
from math import gcd

def a_rec(n, memo):
    if n < 2: return 1
    if memo[n] == 0:
        if gcd(n, a_rec(n - 1, memo)) == 1: memo[n] = a_rec(n - 1, memo) + n + 1
        else: memo[n] = int(a_rec(n - 1, memo) / gcd(n, a_rec(n - 1, memo)))
    return memo[n]
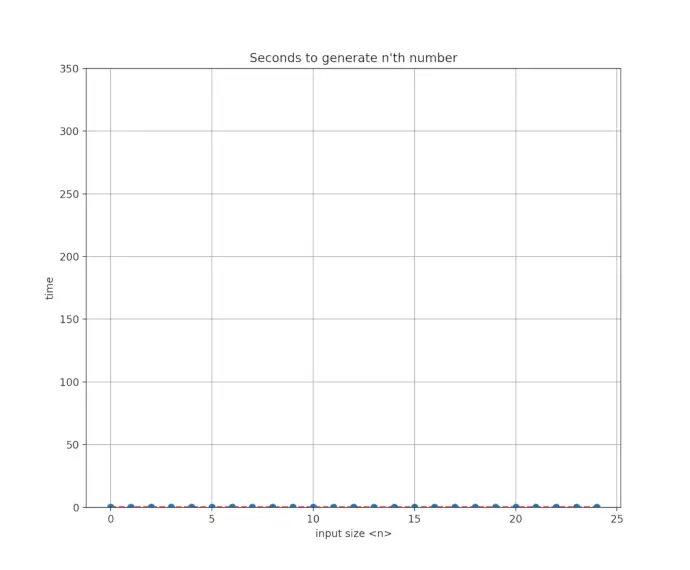
If we plot the runtime in seconds again, we indeed now get a linear runtime behavior:

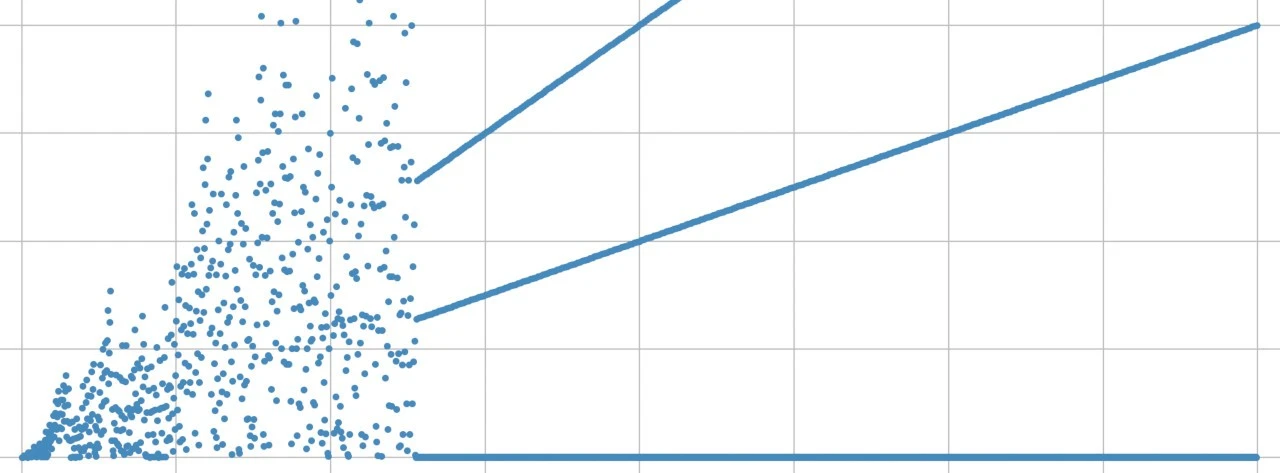
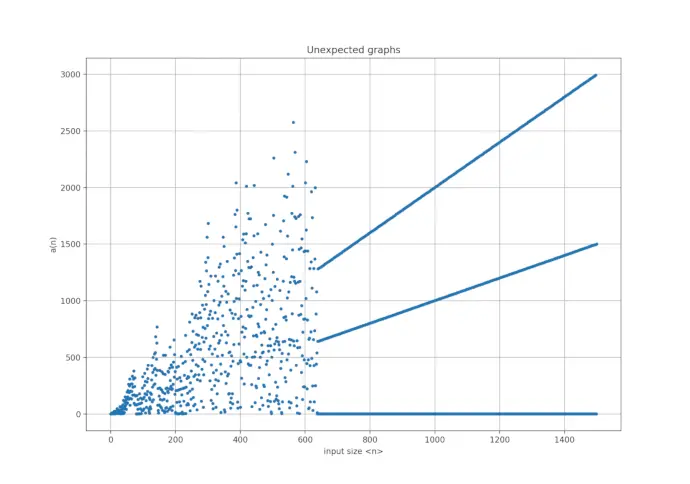
With the computation problem out of the way, we can finally calculate the initial graph and enjoy its strange progression:

If this generated enough interest on why this graph behaves totally different (and creates lines rather than random noise) beginning with n > 638, I’d suggest watching the video over at Numberphile: Amazing Graphs.
I’m available for software consultancy, training and mentoring. Please contact me, if you are interested in my services.